


LabTools

software for the working research lab

Built because research labs need better tools.

Practical software for the problems that slow research labs down: SPECT, PET and CT visualization and 3D rendering, isotope decay and inventory, SOPs, animal transfers and laboratory operations. Most tools run locally, on your own computer.

  • Preclinical imaging cores
  • Radiochemistry & nuclear medicine labs
  • Animal facilities
  • Histology & pathology labs
  • Any academic lab with SOPs to keep
  • Built for real workflows

    Designed around the problems researchers meet at the scanner, in the hot lab and in the office, not around a feature list.

  • Runs where your data lives

    Browser tools are one HTML file; Python tools run on your machine. No accounts, no uploads.

  • Made to be useful

    Small, focused applications that do one job well, rather than another giant laboratory platform.

  • Free to start

    Open source where the code is public, free for academic use elsewhere. The two facility-grade tools have a free tier and a per-site licence beyond it.

Every tool here
started as a
bottleneck in
a real lab.

<tool by tool>

Each tool, in detail.

<imaging>

3D Slicer module

MIRA

Multimodal Imaging Render & Animation

Publication-grade stills and cinematic rotation movies from preclinical SPECT, PET and CT, without learning every menu in 3D Slicer.

Coming soonMIT when released · Pro tier via MIRF

Read more

How it works

  1. Load the CT and the SPECT or PET volume; MIRA registers the display so both sit in the same frame.

  2. Pick a look: curated CT presets (bone, soft tissue, full body) and ten SPECT/PET colour maps with matching windows.

  3. Set the camera: a rotation axis, a start angle and a duration, previewed live.

  4. Export a still for a figure or a rotation movie in HD, 4K or 8K.
Browser · local

MOSAIC

Multi-panel Overlay & Screenshot Arrangement of Imaging Compositions

The figure every imaging paper needs, animals down and time points across, assembled in minutes instead of an afternoon in PowerPoint.

Live100% local · free for academic use

Open MOSAIC

How it works

  1. Drop in screenshots from any scanner software; nothing is uploaded, the page runs locally.

  2. Arrange the grid: rows for animals or groups, columns for time points; a missing panel never breaks the layout.

  3. Add the reference elements reviewers ask for: a shared colour bar with units, scale labels, consistent typography.

  4. Export a journal-ready figure at print resolution.

Desktop

SpectraViewer

Volumes, spectra and time series, side by side

Multi-dimensional imaging data usually means three windows and a spreadsheet. SpectraViewer puts the image, its spectrum and its time course in one view.

Coming soonAcademic · free when released

Tell me when it's ready

How it works

  1. Open a volume together with its spectral or dynamic data.

  2. Point at a region and the spectrum and time series update for it.

  3. Compare regions or animals side by side on shared axes.

  4. Export the panels and the underlying numbers.

<quantification>

Python

HgQuant

Decay correction for the mercury-197 isomer pair

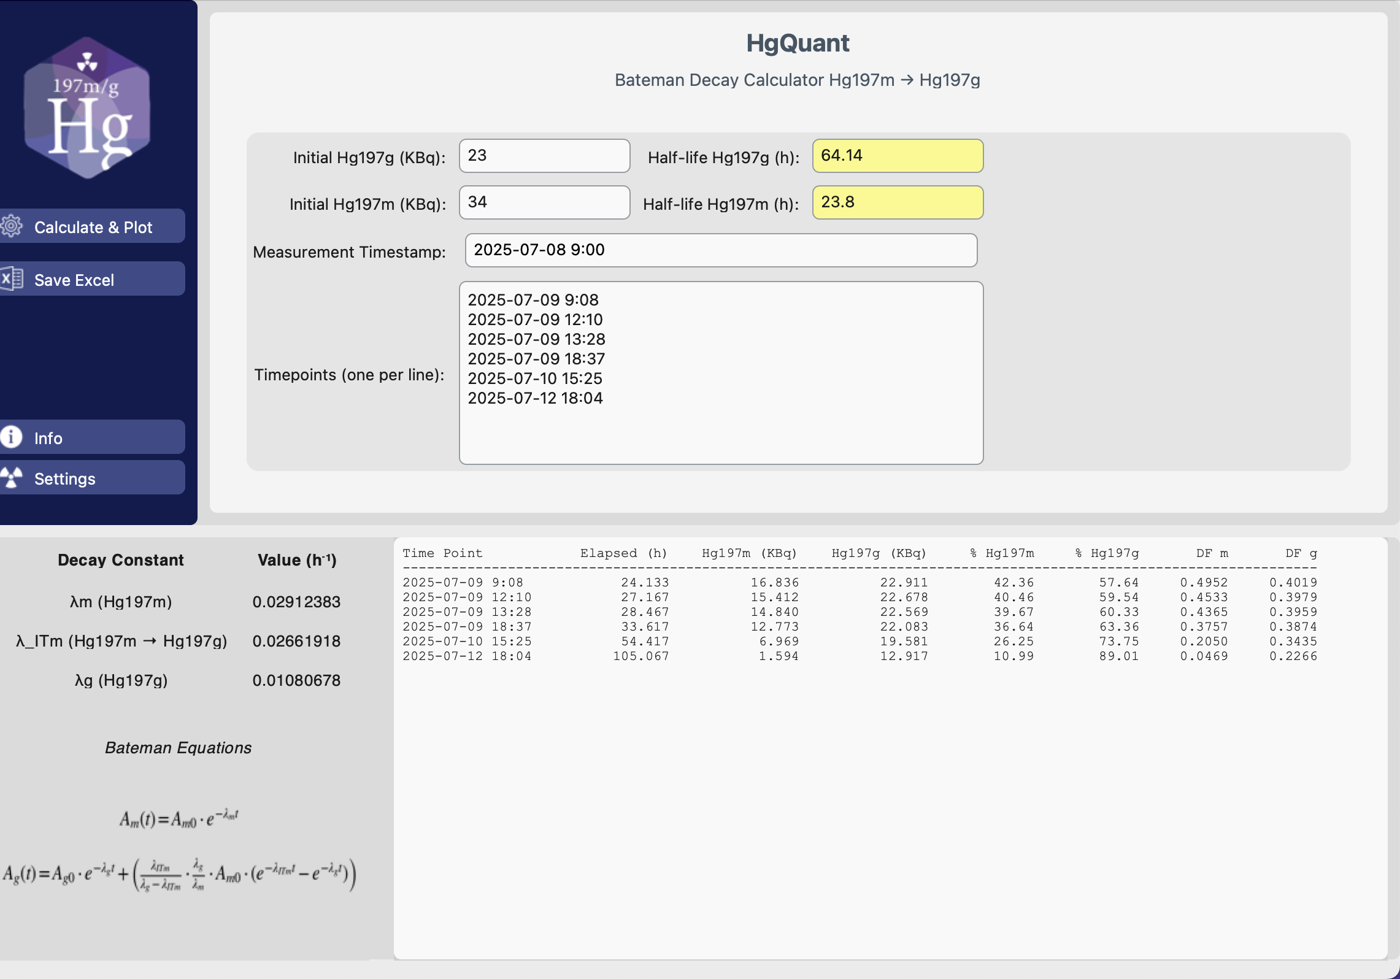
¹⁹⁷ᵐHg decays into ¹⁹⁷ᵍHg while you image, so a plain half-life correction is wrong. HgQuant solves the Bateman equations so every time point is corrected for both isomers at once.

Open sourceMIT

View on GitHub

Used in the dual-isotope ¹⁹⁷ᵐ⁄ᵍHg SPECT/CT work published in EJNMMI Radiopharmacy and Chemistry, 2025.

How it works

  1. Enter the starting activities of ¹⁹⁷ᵐHg and ¹⁹⁷ᵍHg and the reference time; half-lives and branching are built in.

  2. Add your time points: phantom scans, in vivo scans, ex vivo counting.

  3. Read the correction: decay factors and isomer ratio at each time point, as a table and a plot.

  4. Export an Excel report and the figures for the study record.

HgQuant
Inputs on top, the Bateman constants and equations on the left, and the corrected activities per time point below.

<operations>

Desktop

RadioInventory

Isotope stock that decays itself

A radiation-safety audit asks one question: how much of what is where, right now? RadioInventory answers it because every vial is decay-corrected to the moment you look.

In testingFree up to 30 isotope receipts a year · facility licence beyond

Tell me when it's ready

Small labs use it free. A facility that outgrows the free tier licenses it per site, per year, which funds support and updates.

How it works

  1. Log a receipt: isotope, activity, reference time, vial and location.

  2. Record each withdrawal against a study; the remaining activity is recalculated.

  3. See the whole facility at a glance: current activity per isotope, per room, per licence limit.

  4. Export the records a licence inspection expects: receipts, usage and disposal.

Browser · local

SOP Manager

Standard operating procedures with version control

SOPs live in a folder of Word files until an inspector asks which version was in force. SOP Manager keeps Draft, In Review, Active and Retired as states, not file names.

Coming soon100% local · free for research labs

See every screen Tell me when it's ready

How it works

  1. Create an SOP from a branded template; steps are auto-numbered and the document code (SOP-TEC-001) is assigned for you.

  2. Move it through review: Draft, In Review, Active; a revision creates version .02 and retires .01 without deleting it.

  3. Find anything in the library by code, title, type or status, and print a Master Index.

  4. Export Word or PDF for signatures; back up and restore the whole library as one file. Everything stays in your browser.

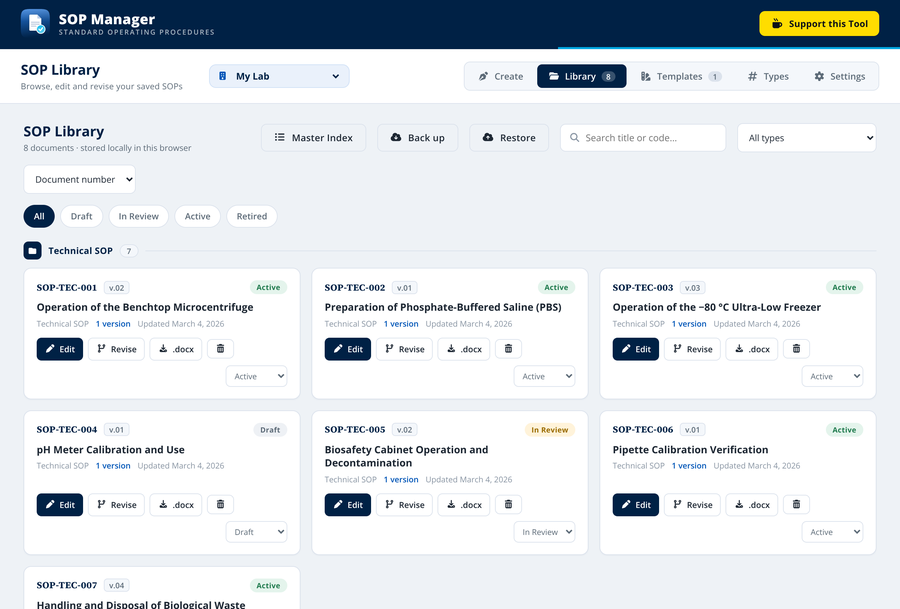
SOP Manager
The library view: each SOP with its code, version, type and state.

Python · Streamlit

Rodent Transfer Portal

Animal transfers between facilities, on the record

A transfer used to be an email thread, a PDF and a phone call. The portal turns it into one request, one form, one audit trail.

Open sourceMIT

View on GitHub

Built for the Centre for Comparative Medicine at UBC; runs on any Python 3 machine.

How it works

  1. Submit a request as an authorized user: animals, protocol, origin and destination, with cage maps and monitoring sheets attached.

  2. The transfer form is generated as a PDF from the request.

  3. Everyone is notified by email: the requester and the facility staff at both ends.

  4. The record stays searchable for ethics and facility reporting.

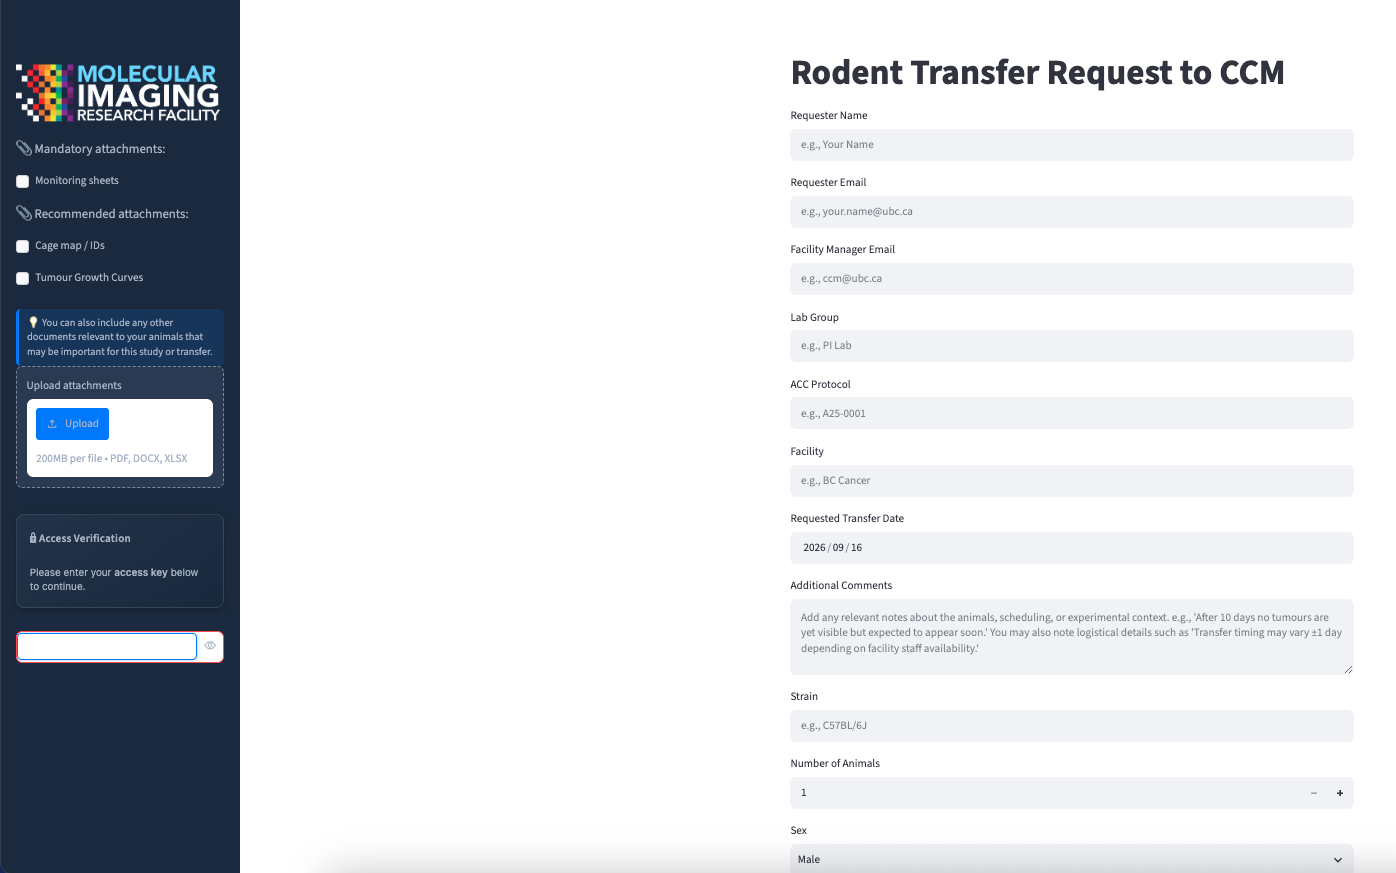
Rodent Transfer Portal
The request form, as an authorized user sees it.

Local database

Antibody DataBank

A fast, local-first database for antibody records

Which lot did we validate for that stain, and who has the vial? Antibody DataBank answers before anyone opens the −80.

In testingFree up to 100 antibody records · facility licence beyond

Tell me when it's ready

Small labs use it free. A facility that outgrows the free tier licenses it per site, per year, which funds support and updates.

How it works

  1. Add a record: target, host, clone, supplier, catalogue and lot number, storage location and validation details.

  2. Search and curate across every field; mark what is validated, running low, or to reorder.

  3. Export the list for an order, a methods section or a lab hand-over.

Word / PDF

FolioLab

Branded templates for the paperwork a lab produces

Reports, protocols, user manuals and manuscripts that start consistent, so the effort goes into the content rather than the formatting.

In testingAcademic · lab toolkit

Tell me when it's ready

How it works

  1. Pick a template: lab report, protocol, user manual or manuscript, with the facility's typography, headers and numbering.

  2. Fill the structured sections and the layout takes care of itself.

  3. Export to Word or PDF and hand it over.

<find your tool>

What are you trying to do?

Start from the problem, not the program: what you need, which tool does it, where it runs, and what it costs a research lab.

I need to…ToolRunsStatusResearch labs
Make a rotation movie or a 3D still from SPECT/PET/CTMIRA3D Slicer moduleComing soonFree (MIT), coming soon
Build a multi-panel imaging figure with consistent colour barsMOSAICBrowser · localLiveFree
See an image next to its spectrum and time courseSpectraViewerDesktopComing soonFree, coming soon
Decay-correct ¹⁹⁷ᵐHg / ¹⁹⁷ᵍHg measurementsHgQuantPythonOpen sourceFree (MIT)
Know how much isotope is in the building right nowRadioInventoryDesktopIn testingFree tier, then licence
Keep SOPs versioned and inspection-readySOP ManagerBrowser · localComing soonFree, coming soon
Move animals between facilities with a paper trailRodent Transfer PortalPython · StreamlitOpen sourceFree (MIT)
Track antibody lots, validation and stockAntibody DataBankLocal databaseIn testingFree tier, then licence
Start a report, protocol or manuscript from a lab templateFolioLabWord / PDFIn testingFree, in testing

<about labtools>

Built by a scientist who runs the lab.

LabTools is developed and maintained by Cristina Rodríguez, PhD, a preclinical imaging scientist who manages the Molecular Imaging Research Facility at the University of British Columbia. Each tool started as a bottleneck in that facility: a figure that took an afternoon in PowerPoint, an isotope correction done by hand, an SOP nobody could find the current version of.

The tools are written to be used by the person who wrote them, then shared. They stay small, run where your data is, and grow one problem at a time. LabTools is an independent project, not a UBC product, and new tools are added as new bottlenecks appear, in this facility or in yours.

Bring LabTools into your lab.

The open-source tools are yours to clone today. For the others, or to adapt one to your facility's workflow, write to me. The ones that started as my bottleneck may already solve yours.